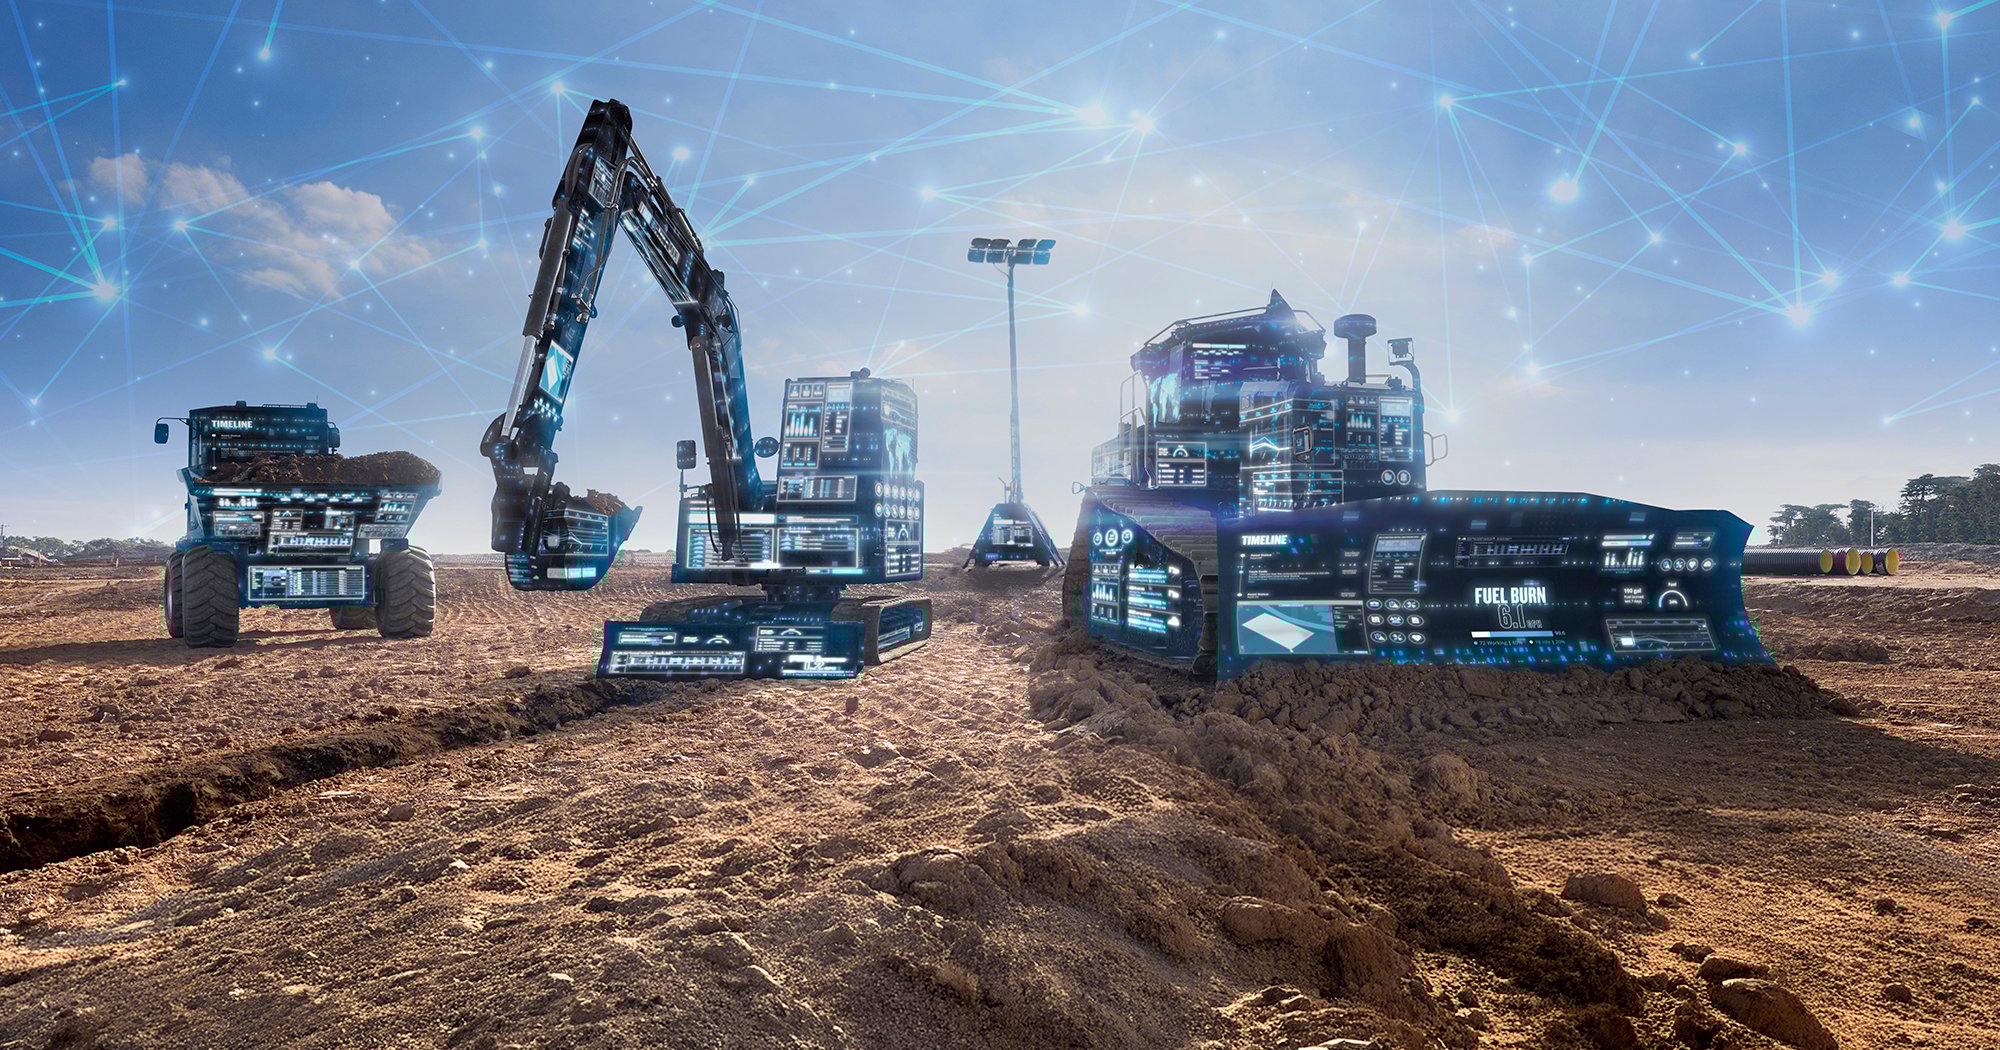
When fuel costs rise, every hour matters more. To be fuel-efficient, the right equipment needs to be in the right place at the right time. VisionLink is an essential asset management solution that provides easy-to-understand, actionable insights.
Better visibility starts with better data
VisionLink gives you a clear, fleet-wide view across equipment, vehicles, generators, and work tools. It also helps create a more complete view of mixed fleets by pulling in data from third-party and other OEM sources. Users can track location, hours, faults, fuel levels, CO2 emissions, and more.
See where fuel is being used — and wasted
The cost of idling adds up quickly, contributing to increased fuel costs, additional maintenance requirements, equipment depreciation, and environmental concerns. The average industry idle time is between 40 and 50 percent, but it’s possible to bring that below 20 percent with the right tools and habits.
VisionLink helps teams see fuel levels, fuel burn, and where machines are working so they can spot waste sooner. Equipment use is maximized by tracking idle time and segments, giving you a better view of where machines are running without doing productive work.

Improve efficiency across operators and equipment
The platform also helps users look beyond a single machine or a single metric. Depending on the machine and its telematics capabilities, VisionLink can show how equipment is being used, where time is being lost, and where efficiency can improve.
With that level of visibility, teams can see how equipment is actually performing and where to improve.
Operator behaviour and machine efficiency are part of that equation. VisionLink data provides insights that can help improve operator performance, increase uptime, and keep equipment focused on the task at hand. It also includes manpower-monitoring features that can support training and workflow improvement opportunities.
Optimize fleet utilization across jobsites
Across multiple jobsites, VisionLink helps teams keep track of where assets are assigned and how they are being used. It can automatically organize assets by project, jobsite, or geofence, giving users clearer visibility into where equipment is deployed and how it’s performing across operations.
For businesses managing multiple assets and multiple jobsites, that makes it easier to see patterns and act on them.
.jpg?width=1400&height=700&name=D6-20XE%20idle%20time%20(2).jpg)
| Idle % | 50% | 30% | 15% |
| Annual | |||
| Working Hours | 1,000 | 1,000 | 1,000 |
| Idle Hours | 1,000 | 420 | 175 |
| Run Time (hours) | 2,000 | 1,420 | 1,175 |
| After 5 Years | |||
| Total run time | 10,000 h | 7,100 h | 5,875 h |
| Total idle time | 5,000 h | 2,100 h | 875 h |
| Total idle fuel burn | 19,500 L | 8,190 L | 3,413 L |
| Fuel savings (@$2.00/L) | - | $ 22,620 | $ 32,175 |
| 500-hour service events | - | -6 | -9 |
| Maintenance savings | - | $ 30,142 | $ 45,400 |
| Warranty savings | - | $ 39,580 | $58,150 |
| Depreciation savings | - | $ 70,000 | $ 140,000 |
| Total Savings | - | $ 162,342 | $ 275,725 |
A machine with high idle time will cost $275,000 more to own and operate over five years than the same machine
with low idle time, as shown in the graphic.
Turn insights into action
It also helps teams stay ahead of maintenance by surfacing machine health information, service alerts, and other signs that equipment needs attention.
As costs rise, better data can have a big impact.
VisionLink helps turn fleet information into practical decisions — reducing unnecessary idle time, understanding fuel use, improving utilization, tracking efficiency, and managing mixed fleets in one place. For equipment owners looking to reduce waste, improve productivity, and protect profitability, it offers clear paths to action.
Interested in how VisionLink can optimize your fleet? Contact your Toromont representative for more information about getting started.

.png)